Deploying data visualization tools PRiME-R

The New Medical Real World Data Research Institute (PRiME-R) uses Cyber Oncology, an input support system for electronic medical records that standardizes/structures real world data such as electronic medical record data related to cancer drug treatment and creates a database. We will begin providing the real-world data visualization tool “Cyber Oncology Analysis” to medical institutions.
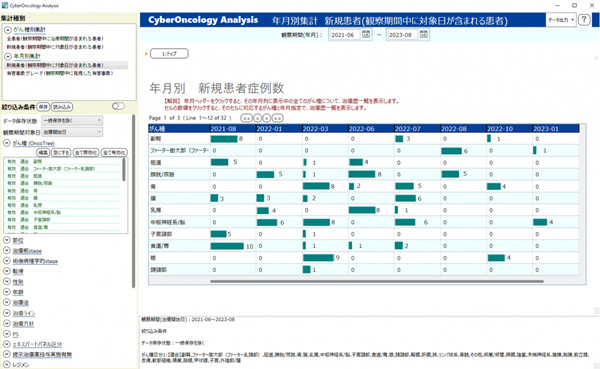
This tool aggregates and visualizes the number of cases entered into Cyber Oncology within a medical institution by year and month/cancer type. It also displays the number of cases by month and year and by cancer type in tables and graphs. The number of cases by cancer type is also displayed in a pie chart.
Usage scenarios include “understanding the number of patients by cancer type in the hospital and confirming treatment details and results,” “answering inquiries from outside the department,” “utilizing past treatment data in daily medical treatment,” and “searching for patients eligible for clinical trials, etc.” ” and “Data aggregation for presentations at academic conferences, etc.”
Many users of Cyber Oncology requested an application function that would allow them to easily aggregate and visualize data stored in the system within the hospital. Cyber Oncology Analysis is a response to these voices.
